 min read
At Atidot we put a lot of effort into collecting as much data as we can in order to improve our modelling and understanding of the life insurance industry. Our Data Scientists love this approach – it enables us to use hard numbers to support our analyses. One data source that we've been wanting to examine are US life insurers' Statutory Annual Statements. This blog post summarizes a quick research project we just completed to extract and analyze data from these Statements.
What's in a Statutory Annual Statement?
The Statutory Annual Statement contains a wealth of financial and insurance information about an insurer, including, for example, Premiums collected, Reserves, Cash Flows, Reinsurance, etc. From a data perspective, we like to compare it to a thorough "financial blood-test", measuring the vitals and health of a company, shedding light on how it operates, and in some cases – why they take certain actions. For us, this is invaluable – data like this strengthens the calibration of our algorithms, a key step in our journey to further develop the sophisticated Atidot brain that understands and interprets the life insurance industry.
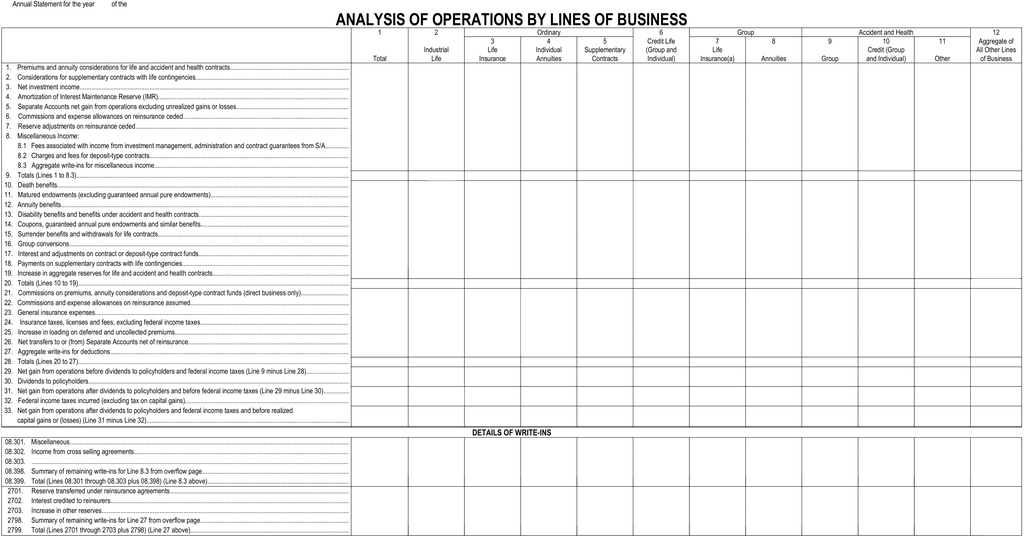
A Google search for statutory annual statements yields some links with downloadable PDF reports, for example:
Example page from a report
PDF Hell
PDF's are great for transmitting documents and other information electronically. But try to convert the pdf into a format in which you can use the numbers – well that's difficult to say the least. Our first step was extracting all the tables we needed of all companies and all years from document files (.PDF) into tabular (.CSV) files. We needed to keep all the numbers in the right order.
This proved to be extremely challenging. We played with the idea of doing this manually, but abandoned the idea pretty quickly. We realized that we needed to develop a fully automatic solution.
One challenge we faced was that in most reports, numbers were encoded with inline PDF Custom Fontsand the standard tools of the trade (e.g. pdftotext) couldn't handle that directly.
We designed several solutions and realized that we need a solution for all extractions of tables with numbers from PDFs and images. This is when we added Image Processing and OCR (Optical Character Recognition) to the mix.
We combined several powerful libraries and tools:
To build an analytics pipeline that: a) cleans the image from small artifacts and noise b) identifies table cells, rows and columns c) does OCR in cells 
Online example (using PDF.js + OpenCV.js)
Advertising Efficacy
With the time we had left we decided to do a quick study of the effects of Advertising on "New Business". Measuring the effectiveness of Advertising is tricky and there are numeruous ways to define it, let alone whether is it good enough or not. Accepting that there are no silver-bullets here, we developed a working definition for this blog post that:
- Is easy enough to understand in this context
- Uses data from several tables
- Incorporates business acumen (e.g. "real value" of First Year premiums)
- Takes the lagging effects of Advertising into account

Illustrated using relevant tables -
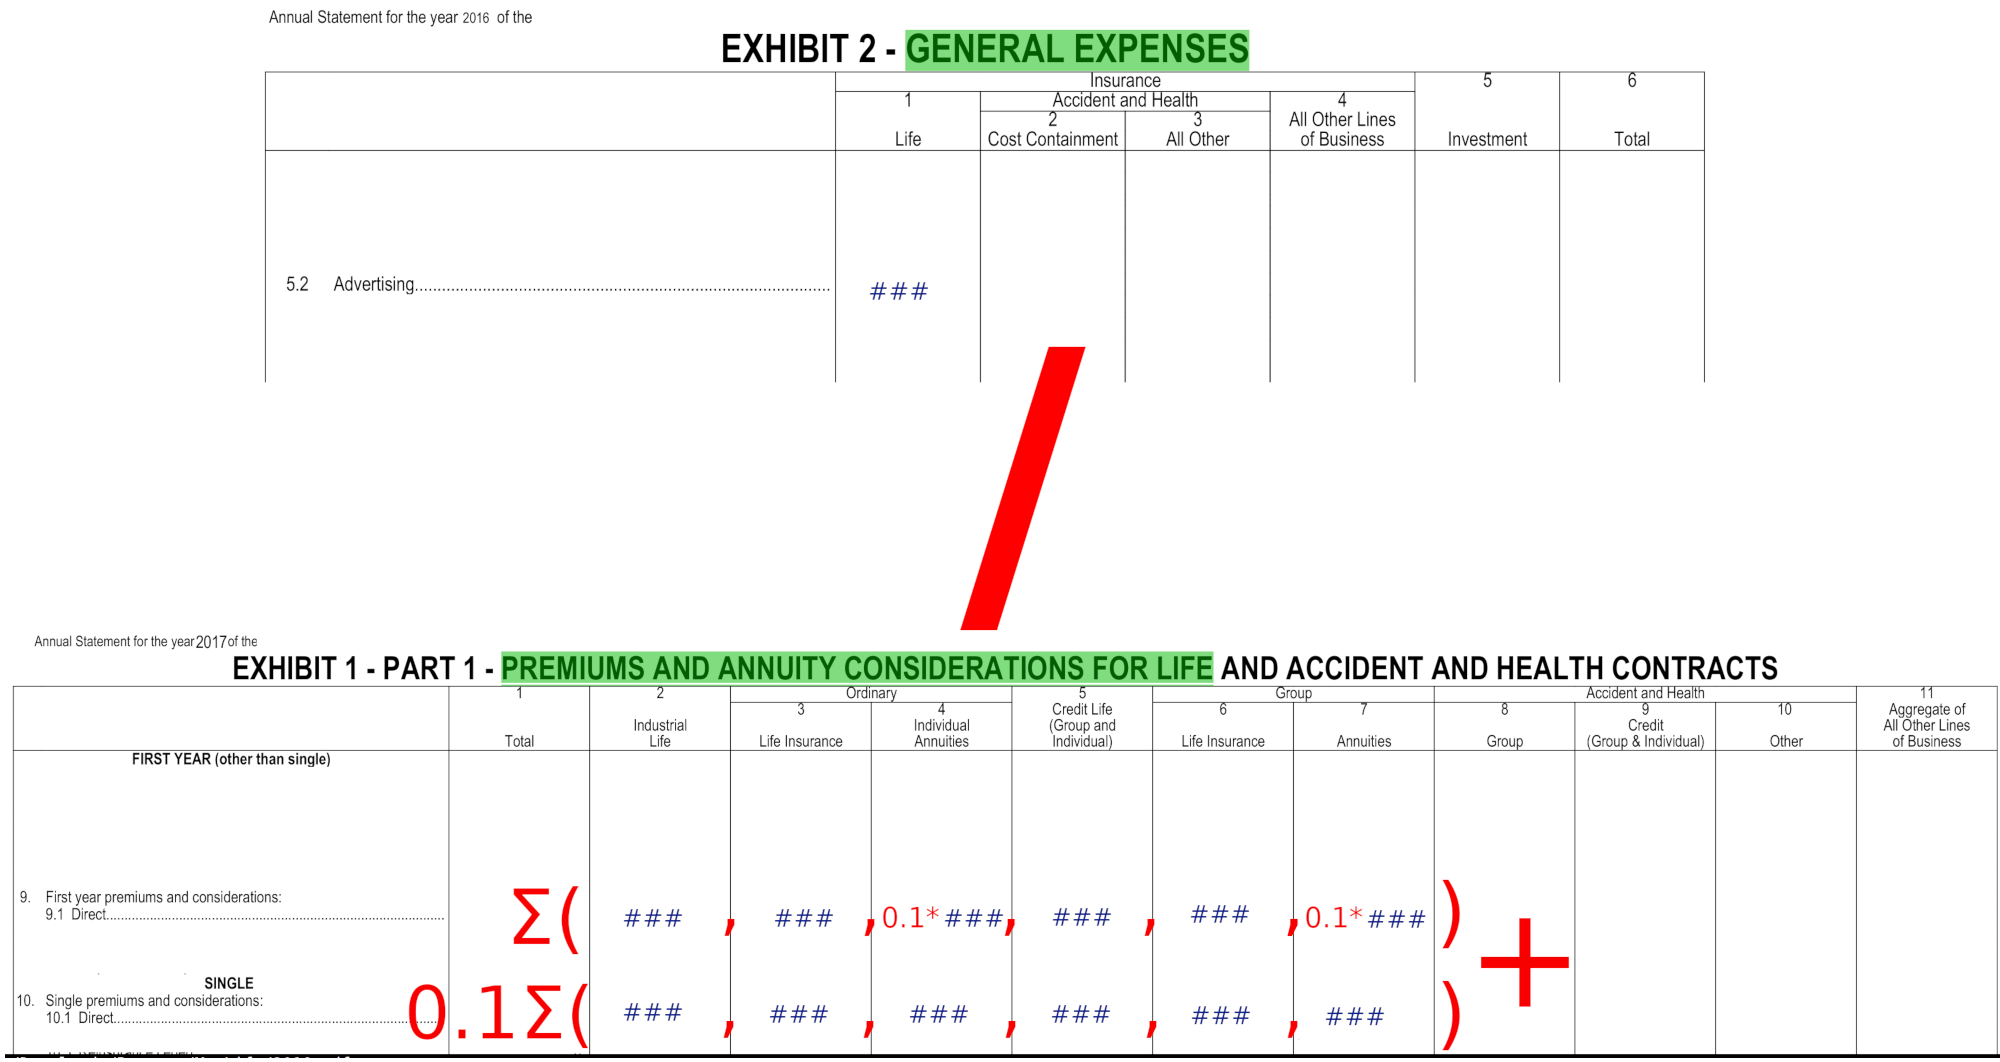
The following chart shows original values from Statements of 5.2 - Advertising expenses - Life for several companies during the years 2015-2017.
While this chart shows our calculated ratio -
(Notably, the Colonial Penn Life Insurance Company stands out for consistently spending on Advertising as much as First Year premiums "value" (as per our normalized definition from above)
Conclusion
We set out to analyze Statements with modern Data Science tools, but as we only had 4 weeks for this work, it became clear very early on that we would update our objective and first improve our PDF data extraction capabilities. We're very happy with the results - we're now able to extract virtually any table from a PDF or image format.
Of course, we haven't forgotten our initial goal - we still care about the data and what it says. In a future post we are going to test some advanced Machine Learning techniques (like Deep-Neural-Network) and share the insights we develop.
If you find this interesting and want to learn more, please contact us at: info@atidot.com

 min read

 min read