Life Insurers- It’s Time To Optimize Your Data

Life Insurers- It’s Time To Optimize Your Data

by: Dror Katzav, CEO and Founder

December 28th, 2021

Life insurance margins continue to be squeezed due to the plunging interest rates, as well as the precipitous drop in the stock market and global economic crises. The much-awaited rise in interest rates has not materialized, and recent events such as COVID-19 and high unemployment rates make it clear that they will continue to plunge. As a result, it is crucial for life insurance providers to find new ways to maximize the revenue opportunities available to them, such as locating current policyholders who possess the potential for substantial upsell, and next-gen customers that are looking for personalization, all are likely to purchase better life insurance and become a Very Important Policy (VIPs).


A tailored approach for these VIP customers will be exponentially valuable in the current turmoil. While insurance companies are aware of who their current important policyholders are, how can they better understand and identify the policies with the most potential? Once identified, how can they optimize methods for best engaging and converting them? The answer lies in optimizing the data they already have to generate insights on the life cycle of their policyholders. Understanding and predicting policyholder behaviors and alerting the agent at the right time to a potential change or discrepancy in the customer’s profile could be a saving grace for life insurance providers in times of economic uncertainty.


Looking Inward for New Revenue 


Now more than ever, insurance companies must pay more attention to the untapped potential in their book of business. Interest rates have dropped significantly, drastically affecting the assets and liabilities of providers. As lower interest rates make the insurance company’s products less attractive, sales continue to drop, further reducing the revenue available for investments.


While insurance companies may choose to address problems in the market by looking for new opportunities for growth to ensure efficiency and profitability, they should be focusing on optimizing what they already have – starting with their book of business.


Finding Gold in a Mine of Data 


How can carriers find untapped segments? The answer already lies at their fingertips. The vast amount of data they already have can assist them in clearly identifying the opportunities for upsell.


New technologies can transform the data into actionable insights and prediction data, enabling providers to empower their agents to address the unmet areas and optimize their books of business.


Why is it still so hard to identify the most important users? Many agents are still largely relying on subjective memory and personal experience rather than basing actions on statistics and data.


By having amassed massive quantities of data, life insurance providers have the ultimate big picture of their customers. Consumers and providers, however, lose out when carriers don’t zoom in on segments and nano-segments and therefore fail to identify opportunities for upsell. Even when potential upsell is identified, if agents are not informed with actionable insights, none of it matters.


Insurance carriers know a lot about every policyholder based on the data they hold. Utilizing predictive analytics to dig into the data and identify the opportunities for upsell ( i.e.,the underinsured policyholders) can create a win-win-win situation for policyholders, agents, and carriers alike. The segments that can be revealed include those that answer to the following questions:

  • Has a policyholder just moved into an affluent suburb with excellent schools? Successful predictive analytics could indicate that this family should belong in another segment, as predictive analytics calculates that they will likely move into a higher income neighborhood, buy a more expensive car, etc.
  • What if a married father of 3 starts paying rent for a 1 bedroom home. Could this mean that a divorce is at play? If so, his policy would need to be fixed and redirected to benefit kids, and no longer his wife.
  • Does the policyholder enjoy skiing? If a policyholder has a preference for extreme sports and has taken out a policy to cover skiing holidays, they would be segmented into a specific group. If within that group, 90% of them have a certain plan, but 10% still don’t, this is a prime and untouched opportunity for agents to target that 10%.


Empowering their agents with information that would identify their underinsured policyholders who have a great potential for upsell can maximize revenue on their book of business in the long run. To achieve this goal, they need to turn inwards and draw on the raw data they already have.


The Right Touch at the Right Time 


Tapping into the life-cycle of a policyholder and alerting the agent at the right time to a potential change or discrepancy in the customer’s profile could be a saving grace for life insurance providers in economic uncertainty.


On top of this, the client receives more personalized attention: 88% of insurance consumers demand more personalization from providers, but until now providers haven’t had a reliable way to provide personalized service. Any attempts to provide this service, such as frequent check-ins, annoy rather than provide value to the customer.


Once the customer’s growth potential is identified, agents must also know how to maintain them.


This critical interaction, which sometimes lasts no longer than 5 minutes, could make or break an agreement. Knowing when to contact the customer is crucial. Insurers should be careful not to offer the wrong policy to the wrong person at the wrong time. This is not just to avoid wasting effort and resources,rather, they could be risking the lifetime value of a customer, as the customer may be reminded that they don’t necessarily need the policy and thus cancel it.


Some insurance companies are still unaware of the most accessible and lucrative solution: finding the potential within their book of business through accurate data collection and processing the data they already have. Using predictive analytics to identify the core policyholders who are underinsured, is a win-win for both agents and clients.

Leading Insurance Talent Joins Atidot’s Executive Team

Leading Insurance Talent Joins Atidot’s Executive Team

by: Dror Katzav, CEO and Founder

March 4th, 2021

Martin is a member of the Big Data Task Force of the American Academy of Actuaries and led the development of the industry’s first ULSG priced with Principle-Based Reserves, as well as the conversion of the pricing models to a new platform.

Martin’s CDO appointment complements the founding team of data scientists and actuaries, including the former Chief Actuary at the Israel Ministry of Finance. The expanding team is working with leading insurance providers to enable them to take control of their existing data to strengthen policyholder retention, sales, and in-force management, driving both top-line and bottom-line growth.

The Israel-based startup caters to the unique requirements of its customers and harnesses advanced artificial intelligence, machine learning, and predictive analytics to enable life insurers and annuity writers to make data-driven business decisions. Atidot focuses specifically on the life insurance industry (valued at $597 billion in the US alone), offering insurers an easy-to-use and secure SaaS predictive analytics platform. The company utilizes underused and often neglected sources of data as well as open access information to enhance existing business models.

How exactly will insurers benefit from the Atidot platform? Martin sees it this way: “Life insurers and annuity writers can develop new strategies for their in-force management and new business activities through the insights generated by predictive analytics.”

Martin is a frequent speaker at Society of Actuaries meetings. Most recently, he spoke at the Society of Actuaries Life and Annuity Symposium in Baltimore, Maryland, on May 7 and 8. Martin moderated and presented at Session 36 on the Risk Management Process in Product Development” and led a workshop at Session 81 on How AI is being used in Distribution, Product Development, Pricing, and Underwriting.

Keep an eye out for future Atidot executive spottings – coming soon!

Analysis of Statutory Annual Statements (Part 1)

Analysis of Statutory Annual Statements (Part 1)

by: Dror Katzav, CEO and Founder

February 24th, 2021

At Atidot we put a lot of effort into collecting as much data as we can in order to improve our modelling and understanding of the life insurance industry. Our Data Scientists love this approach – it enables us to use hard numbers to support our analyses. One data source that we've been wanting to examine are US life insurers' Statutory Annual Statements. This blog post summarizes a quick research project we just completed to extract and analyze data from these Statements.


What's in a Statutory Annual Statement?

The Statutory Annual Statement contains a wealth of financial and insurance information about an insurer, including, for example, Premiums collected, Reserves, Cash Flows, Reinsurance, etc. From a data perspective, we like to compare it to a thorough "financial blood-test", measuring the vitals and health of a company, shedding light on how it operates, and in some cases – why they take certain actions. For us, this is invaluable – data like this strengthens the calibration of our algorithms, a key step in our journey to further develop the sophisticated Atidot brain that understands and interprets the life insurance industry.

A Google search for statutory annual statements yields some links with downloadable PDF reports, for example:

Example page from a report


PDF Hell

PDF's are great for transmitting documents and other information electronically. But try to convert the pdf into a format in which you can use the numbers – well that's difficult to say the least. Our first step was extracting all the tables we needed of all companies and all years from document files (.PDF) into tabular (.CSV) files. We needed to keep all the numbers in the right order.
This proved to be extremely challenging. We played with the idea of doing this manually, but abandoned the idea pretty quickly. We realized that we needed to develop a fully automatic solution.
One challenge we faced was that in most reports, numbers were encoded with inline PDF Custom Fontsand the standard tools of the trade (e.g. pdftotext) couldn't handle that directly.
We designed several solutions and realized that we need a solution for all extractions of tables with numbers from PDFs and images. This is when we added Image Processing and OCR (Optical Character Recognition) to the mix.

We combined several powerful libraries and tools:

To build an analytics pipeline that: a) cleans the image from small artifacts and noise b) identifies table cells, rows and columns c) does OCR in cells

Online example (using PDF.js + OpenCV.js)


Advertising Efficacy

With the time we had left we decided to do a quick study of the effects of Advertising on "New Business". Measuring the effectiveness of Advertising is tricky and there are numeruous ways to define it, let alone whether is it good enough or not. Accepting that there are no silver-bullets here, we developed a working definition for this blog post that:

  • Is easy enough to understand in this context
  • Uses data from several tables
  • Incorporates business acumen (e.g. "real value" of First Year premiums)
  • Takes the lagging effects of Advertising into account

Illustrated using relevant tables -

The following chart shows original values from Statements of 5.2 - Advertising expenses - Life for several companies during the years 2015-2017.


While this chart shows our calculated ratio -
(Notably, the Colonial Penn Life Insurance Company stands out for consistently spending on Advertising as much as First Year premiums "value" (as per our normalized definition from above)


Conclusion

We set out to analyze Statements with modern Data Science tools, but as we only had 4 weeks for this work, it became clear very early on that we would update our objective and first improve our PDF data extraction capabilities. We're very happy with the results - we're now able to extract virtually any table from a PDF or image format.
Of course, we haven't forgotten our initial goal - we still care about the data and what it says. In a future post we are going to test some advanced Machine Learning techniques (like Deep-Neural-Network) and share the insights we develop.
If you find this interesting and want to learn more, please contact us at: info@atidot.com

Transform Your Business With Predictive Analytics

Transform Your Business With Predictive Analytics

by: Dror Katzav, CEO and Founder

February 23rd, 2021

Predictive analytics and artificial intelligence (AI) are the most transformative developments in the history of life and annuity products, with early adapters poised to achieve major strategic advantages.


Predictive analytics can enable us to understand better the complex causal relationships that affect the performance of our business in real-time, thereby enabling exponential strategic advantages. In other words, we have the predictive insights in time to act on them, enabling the business to be proactive rather than reactive.


Personalization in the life insurance industry


I own a life insurance policy from one of the largest life insurers. The closest they have come to recommend a product is to send a list of all the products they offer and suggest that I spend time discussing my needs with the agent.


I also own automobile and homeowners insurance from one of the largest P&C writers. Every few years, they recommended that I buy $100,000 of life insurance. But this is not personalized! In the 21st Century, people expect smart services. The likes of Amazon and Google have learned to maximize engagement with their platforms by interacting with their user bases dynamically. What will it take for our industry to catch up to those born in the digital age?


Perhaps experts have studied the issue and determined that additional predictive analytics is unable to help our industry. However, I believe this is simply not true.


Suppose that Company A has poor lapse experience and wants to determine what it can do to improve its persistence. They can call everyone who lapses, find out their issues, and try to convince them to reinstate. At best, this would be post-hoc and expensive.


They could call in-force policyholders instead before lapsation happens, but it would be hit or miss on whether they are calling customers at risk, and hence an expensive proposition with dubious results. Worse yet, some policyholders who otherwise would not have lapsed may get the idea from these calls to lapse their policies. So, how can predictive analytics help Company A improve its retention?


Knowledge is power


Predictive analytics – without human intervention – has demonstrated that some data, such as the premium payment date – previously thought of by many as important only for administrative purposes – can be significant predictors of lapsation risk.


Lower and middle-income customers who pay their premiums shortly after they receive their paycheck when they have sufficient funds in their checking account are more likely to keep their policies in force. Those customers whose premium due dates fall a long time after they receive their paychecks – by which time they may have spent their most recent paycheck – are more likely to lapse.


Armed with this knowledge and other discoveries generated by predictive analytics, insurers and producers can know which policyholders to call and when as well as why these customers are at high risk.


We produce more refined policyholder segments that have been newly identified and are using more data and extended study periods to set credible lapse rate assumptions with lower variability.


The lapse assumptions are more accurate than those produced previously, and financial models and results will have lower variability. It also provides a launchpad for reducing lapses in the future. Whether this support has strong incremental effects or exponential strategic advantages depends on the insurer’s implementation.


Using automation to gain exponential strategic advantages 


Automating predictive analytics would enable quick analysis of additional potentially predictive factors that arise as well as real-time information on the impact of behavioral, economic, market and other environmental changes. The insurer can then be proactive in improving policyholder retention and understanding its emerging lapse experience, providing exponential strategic advantages.


Returning to the sales process, let us think about how much valuable information we collect that we do not use. For example, when a policyholder notifies us of a change in address, do we treat it purely as an administrative matter, or do we analyze it to see whether the move suggests changed economic or family circumstances and hence an increased need for coverage?


Given that many people simply do not buy what a needs analysis says they should buy, perhaps we can start by letting people know how much coverage others in similar circumstances have. This may not solve the entire gap in life insurance coverage, but it is a message that resonates with customers (as Amazon has demonstrated), and it would be a door opener for us to talk to customers and prospects about their needs.


We, in the life and annuity spaces, have built our businesses by collecting and effectively analyzing huge volumes of data. Let us continue to innovate and use the new tools now available to us to revitalize  – and indeed revolutionize  – our businesses!

Better with Age /The Actuary Magazine

Better with Age /The Actuary Magazine

by: Dror Katzav, CEO and Founder

January 19th, 2021

As featured at the Actuary Magazine : https://theactuarymagazine.org/better-with-age/

FEATURED ARTICLES

Better With Age

Predicting mortality for post-level term insurance

MARTIN SNOW AND ADAM HABER SPRING 2020

Photo: Getty Images/Dimitri Otis

Actuaries have a long and storied history of providing the joint mathematical and business foundation for the insurance industry. Yet, advanced predictive analytics techniques with machine learning (ML) and artificial intelligence (AI) have not made it into the standard toolkit of the typical actuary. Insurers and actuaries could reap major strategic benefits if they were to significantly increase their use of these advanced predictive techniques. In this article, we focus on mortality and lapse studies as one example.

Post-level term (PLT) insurance presents a unique set of challenges when it comes to predicting mortality and lapse experience. After a set period of, say, 10 or 20 years when the policyowner paid level premiums, the premium will rise annually. Customers will be highly motivated to identify all of their other options. Healthier individuals will have good alternatives and lapse their policies; the less healthy ones will remain. The greater the premium increase, the greater this effect will be—resulting in the classic mortality spiral.

How can we get a good quantification of the interrelationship between premium increases and lapse and mortality experience? By building a predictive analytics model—more advanced than those previously developed1,2—to set lapse and mortality assumptions, and price and value PLT insurance. Our model will statistically integrate heterogeneous customer cohorts,3 improve credibility in cohorts with sparse claims data, and provide a more complete understanding of the impact of premium changes on mortality rates. We can only imagine the additional improvements to insurer pricing and financial reporting that could be achieved with broader applicability of these techniques beyond PLT.

OUR PLT MODEL

Our PLT model comprises three advanced predictive methods:

1. An innovative application of a statistical multivariate framework to model PLT lapse and mortality. This multivariate model reflects the causal structure (and almost immediate impact) of PLT lapsation and premium changes on mortality (PLT causal structure4) and provides better guidance for setting PLT premiums. Taking the causal structure into consideration is especially important when answering predictive “what if” questions (e.g., what happens to mortality if we change premiums by X percent).Consistent with our plan to model the lapse rate as a major driver of the dependence of mortality rates on premium level, we make assumptions in our model about the underlying data-generating processes:
· Whether a policyholder lapses at the end of the level term period is a stochastic function of various characteristics such as age, gender, risk class, face amount and the change in premium.
· This function may include complex dependencies among variables. For example, the effect of different face amounts on lapsation may vary by age, gender and so on.
· The differences in both base and shock lapse among cohorts cause perceptible differences in mortality levels.

2. The statistical technique of “partial pooling” to increase the credibility of sparsely populated cohorts. This is especially important when the volume of available data (especially mortality data) differs substantially by cohort, leading to differences in credibility—including cohorts with very limited credibility.

Partial pooling is a principled middle ground between complete pooling, which fits a single model for the entire population and ignores variations, and no pooling, which fits a single model for each cohort and ignores similarities shared among cohorts. Partial pooling is also known as hierarchical partial pooling.

Partial pooling enables us to share information (borrowing strength) among cohorts, regularize6 our model and account for different cohort sizes without incorporating ad hoc solutions. The data for each observed cohort informs and adds credibility to the probability estimates for all of the other cohorts. The extreme estimates are driven toward the population mean (“shrinkage” in Bayesian statistics) with significant lessening of variability that may have been created by noise in the data. This phenomenon is closely related to the concept of bias-variance trade-off,7 in which the tightness of fit to the observed data is reduced, so the derived estimates serve as better predictors. Partial pooling leaves us with better estimates, reduced variability and improved credibility.

Partial pooling smooths mortality estimates, which by itself is not new in actuarial science—different graduation techniques have been developed and implemented over the years. The distinct advantage of partial pooling is that it achieves the same goal by explicitly sharing information among cohorts in a principled way (guided by domain knowledge and analysis of the data), and it can improve credibility in sparsely populated cohorts.

3. The integrative statistical approach of Bayesian inference 8,9 to quantify differences in experience among cohorts with different exposure levels. The generative nature10 of Bayesian modeling enables the incorporation of expert knowledge into the models in the form of model structure and informed priors.11,12 Bayesian models produce crucial uncertainty estimates (unlike the point estimates supplied by more traditional maximum likelihood approaches) needed for informed decision-making—especially with sparse mortality data. We use Bayesian multivariate modeling of lapse and mortality, but we do not include a numerical comparison of the Bayesian and non-Bayesian approaches in this article due to space considerations.

There are two key elements of our mortality-lapse model. The first is a nonlinear regression lapse model inspired by previous Society of Actuaries (SOA) studies.13,14 We added partial pooling of parameters across cohorts to increase accuracy, credibility and predictability. We changed the link function of the model from log to logit to ensure per-cohort lapsation is bounded by the exposure (previously it was possible for the model to predict more lapses than exposures, i.e., an actual-to-expected ratio > 1).

The second key element of our model is that it is a Bayesian version of the Dukes MacDonald (DM) mortality model.15,16 In this version, we model the effectiveness parameter as a nonlinear function of the cohort characteristics (e.g., age, risk class, gender, etc.), use priors that reflect actuarial knowledge regarding plausible parameter values of G (e.g., a reasonable prior might put more weight on values of G closer to 1 than 0),17 and infer the posterior distribution of G from the data (the distributions over model parameters after conditioning on the data). We use the nonlinear regression lapse model previously described to estimate a distribution of lapse rates by cohort. Mortality is estimated by integrating over two variables: the joint distribution of base/shock lapse rates and the effectiveness parameter, thereby completing the mortality-lapse model.

OUR MODEL IN ACTION

To implement the model, parameters for both the lapse and mortality models were estimated using Stan, a state-of-the-art platform for statistical modeling and high-performance statistical computation.18 We validated the estimates Stan provided with both Bayesian model comparison methods, such as leave-one-out (LOO) and Watanabe–Akaike information criterion (WAIC),19 and actual-to-expected (A/E) ratios.

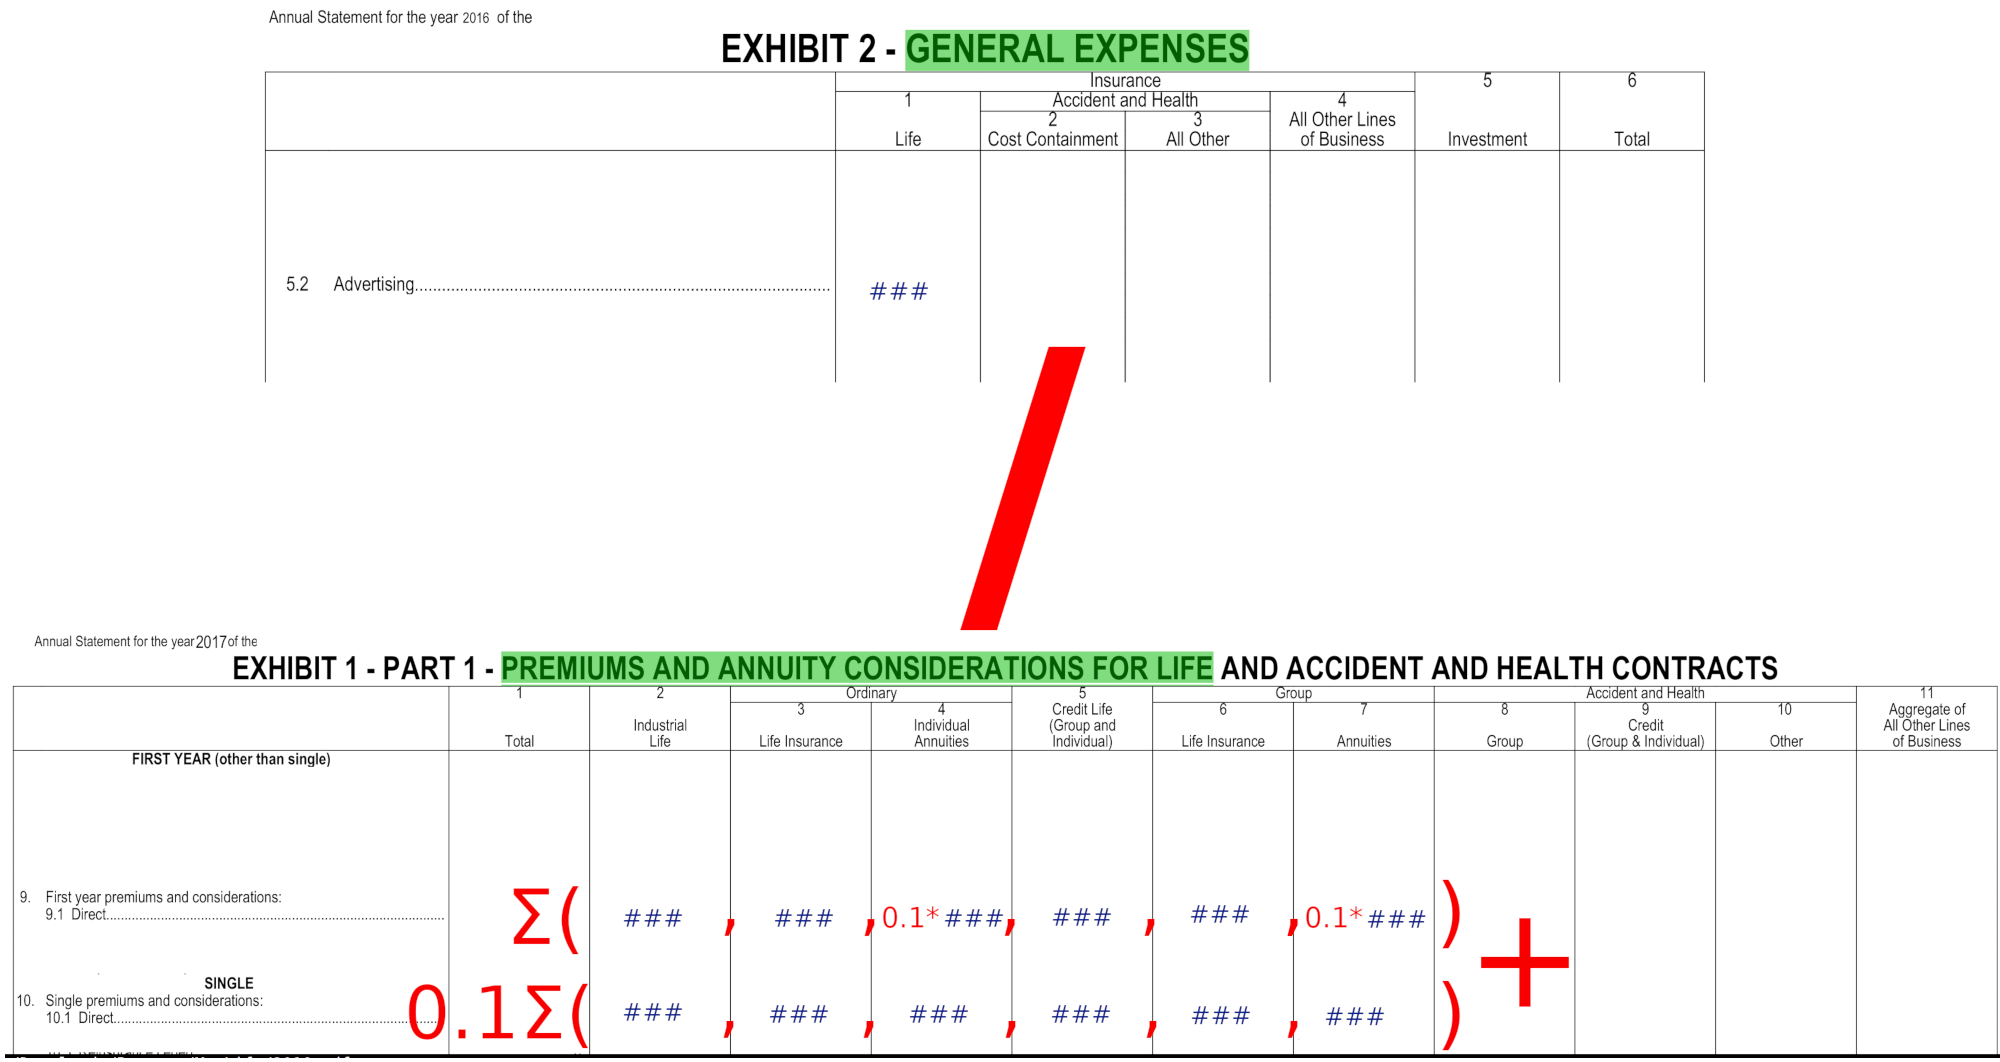
The SOA data20 we used for our modeling, consisting of 8,066 different customer cohorts, is summarized in Figure 1.

Figure 1: Experience Used in the Model

Source: Society of Actuaries. Lapse and Mortality Experience of Post-Level Premium Period Term Plans. Society of Actuaries, 2009 (accessed January 27, 2020).
To quantify and validate the impact of the new Bayesian tools presented, we conducted an analysis. First, for the multivariate modeling of lapse and mortality, we examined three variants of DM mortality estimates:

1. Assume fixed base lapse rates before the PLT period, fixed total lapse rates at the end of the level term period, and fixed effectiveness parameters. Optimal values for base and total lapse rates and the effectiveness parameter were found by using a standard gradient descent optimization algorithm. The lapse and effectiveness parameters do not vary by cohort though the select and point-in-scale mortality do vary by cohort.

2. Empirically assess from the data both the base and total lapse rates by cohort. The effectiveness parameter was fixed. It was optimized using grid search.21

3. Use a partially pooled model to estimate both base and total lapse rates that vary by cohort.

The distribution of the effectiveness parameter was inferred from the data itself using NUTS,22 an adaptive extension of the Hamiltonian Monte Carlo Markov Chain algorithm.23 In each of these variants, expected mortality is computed based on the five input parameters to DM: effectiveness, base lapsation, shock lapsation, select mortality and point-in-scale mortality. The select and point-in-scale mortality used in the computation of expected mortality were selected from standard tables. We compared the actual deaths for each method in each cohort to the expected, and we then computed a weighted error as the mean absolute deviation of the predicted A/E ratio from an A/E ratio of 1, weighted by exposure. Figure 2 shows the results.24

Figure 2: Mean Absolute Deviation of Actual/Expected Ratios

A model such as this can be continually improved. For example, we know mortality is often a bit higher for lower socioeconomic classes. Building in this knowledge may result in an A/E ratio closer to 1. Similarly, upper-income policyholders may have the ability to anti-select, which also could be built into the next model iteration. The Bayesian framework used is especially well-suited to the incorporation of this type of expert knowledge.

For partial pooling when measuring mortality rates, we fit a nonlinear regression model to publicly available mortality data25 with and without partial pooling of model parameters and held all else (e.g., the data and the characteristics being analyzed) constant. We compared the partially pooled model to both regularized and nonregularized nonlinear regression models using R’s glmnet package.

We ran the models with different characteristic subsets to validate that our results are not characteristic-dependent. Almost always, the models without partial pooling of parameters yielded implausible estimates for cohorts with especially low exposures or claims, sometimes deviating from the population mean by more than four orders of magnitude. On the other hand, the mortality rates in the partially pooled model were much closer to the population mean on an exposure-controlled basis. Outlier behavior of the magnitude seen when partial pooling was not used was not observed.

When comparing models using Bayesian selection methods,26 the partially pooled model had significantly better LOO cross validation and WAIC scores, as shown in Figure 3.27

Figure 3: Model Validation Comparison

*For this row, we show values for the regularized (nonpartial pooling) model that gives the best results.

When predicting mortality rates for cohorts with relatively small exposures (~5 percent of the mean per-cohort exposure, 153 cohorts out of 8,000), the nonpooled models yielded mortality estimates that are less than 0.01 percent of the mean mortality rate (interestingly enough, over-estimation was not observed). This under-estimation resulted from improper handling of small sample sizes. These results held even with the regularized models, which are very similar to models with graduation.28
On the other hand, models with partial pooling did not produce such extreme estimates because of the beneficial impacts of shrinkage. Proper handling of mortality estimates in cohorts with small exposures is critical, as such cohorts will almost certainly exist when modeling data at high granularity.

CONCLUSION

This article explored innovative approaches to modeling PLT lapse and mortality. A multivariate PLT lapse and mortality model improves mortality estimates and sheds new light on the interactions among changes in premium, persistency and mortality. Because management would have the information it needs in real time, this transforms pricing, reserving and “what if” analysis.

Partial pooling shares information among cohorts, accounts for different cohort sizes, regularizes estimates and improves credibility. When there are multidimensional cohorts with sparse data, partial pooling can provide unique insights into policyholder behavior, which is very valuable for insurers looking to manage risks and finances and optimize top-line growth.

The Bayesian model allows us to capture our prior knowledge of the data-generating process, such as the reasonable values of the effectiveness parameter. Such a model will be practical and implementable—and not just a nice theoretical toy.

The methods discussed in this article are valuable for answering a widedent, chief delivery officer and chief actuary at Atidot.

Adam Haber is a data scientist at Atidot in Tel Aviv. range of sophisticated actuarial questions. Actuaries and insurers will want to consider how advanced methodologies such as the innovative lapse-mortality model, causal inference and Bayesian decision theory could be used to address crucial challenges. Now that the availability of computational resources facilitates the implementation of these advanced methodologies, insurers face a new imperative. These techniques can be extended to general lapse and mortality studies along with other aspects of the insurer experience. We look forward to seeing the improvements in pricing and reserving (such as for principles-based reserving) and the increases in credibility that will emerge from greater use of these techniques.

Martin Snow, FSA, MAAA, is vice president, chief delivery officer and chief actuary at Atidot.

Adam Haber is a data scientist at Atidot in Tel Aviv.

Need for a Dedicated Coding Language

Need for a Dedicated Coding Language

by: Dror Katzav, CEO and Founder

January 18th, 2021

Why Actuaries Need a Unified, Dedicated Programming Language
By Barak Bercovitz, Atidot Co-Founder & CTO

Insurance is rooted in data innovation. Wide swaths of modern statistics and probability were first devised to accurately price, predict and manage risk. But insurance’s pioneering position has faltered in recent years.

While today’s economy is ablaze with revolutionary advancements in big data and computation, the insurance industry has been uneven in its adoption and application of cutting-edge data technologies. One study found that just 20 percent of the data collected by insurance companies is usable for strategic analysis. Current attempts to incorporate big data and machine learning into insurance products tend to occur on an in-house and ad-hoc basis.

High financial stakes and strict regulations already complicate big data adoption, but beyond that, the lack of a formalized system or computer language for interfacing with the available tools, technologies and data can prove one of the biggest obstacles to progress. This is why the life insurance industry as a whole, and actuaries, in particular, are in dire need of their own unified, dedicated programming language. As the CTO of a startup working with big life insurance companies, my team recognized this pressing need and committed ourselves to authoring an insurance and actuary focused programming language to help fill the gap.

To understand the distinct challenges of applying technical innovations to the insurance industry, it is essential to first peel back the complex layers behind computer applications in general. Computers have come a long way since their earliest days as room-sized mainframes with punch-card readouts. But at their core, all modern computers still reflect this legacy, hard-wired roots. Graphical interfaces and polished applications might make today’s computers more user-friendly, but every action and instruction must still be translated and abstracted into binary machine code in order to be computed on.
Now, this is not to say that developers sit typing their code as zeroes and ones. Rather, modern programming languages use their own, distinct shorthand, which is then compiled into code readable by hardware. However, the particular output logic required varies by computer architecture. GPUs operate differently than CPUs, which operate differently than cloud computing frameworks. Therefore, the trend has been to author general purpose languages (GPL) that focus on accommodating the widest range of uses to a particular machine or architecture. Instead of optimizing for a specific problem or use-case, GPLs ask the programmer to learn a new language and apply it to their given domain.
While this complicates developing specialty applications of any kind, the unique contours of the life insurance industry add an additional layer of difficulty. Regulations governing insurance are among the strictest and most byzantine of any industry. And beyond the issues of compliance come the extraordinary financial and social stakes riding on the integrity of insurance products. Core pillars of the private and public sector are propped up by the accurate, reliable management of risk. Insurance models running on shaky code could turn a tiny software bug into tens of millions in losses, the eventuality of which is only amplified by the enormous complexity of accurately calculating risk five, 10 or even 25 years into the future.

Seeing these issues firsthand inspired development of the Atidot LIA (Language for Insurance and Actuaries). What my team and I realized when approaching this challenge was that what initially looked like one problem was actually three distinct but interrelated issues.

The first issue was the substantial technical demands of carrying out the tasks actuaries would demand of big data. Cleaning and anonymizing raw data, modeling it properly, testing and executing on a laptop or workstation and ensuring all code passed formal verification – these intricate operations would be a baseline requirement of any function.

After addressing the fundamental complexity of insurance operations, the next issue was simplifying the syntax and optimizing legibility for domain experts who might not be professional developers. By building in insurance-specific entities, data models and analytics models for several use-cases, LIA allows actuaries to speak the language of insurance instead of memorizing the arbitrary variables of Python, Visual Basic, or C++.

Lastly, the unification of all necessary functionality into a syntactically legible framework would enable frictionless integration with machine learning models and accelerate time-to-market for new actuarial products. In other words, it would allow actuaries to write, debug and deploy big data in terms they could easily understand. Harmonizing function and syntax would help resolve some of the major roadblocks facing data integration.

The current tension between the enormous promise of big data for the life insurance industry and the difficulty of developing dedicated software contribute to a compromise worse than the sum of its downsides. Today, actuaries looking to incorporate big data or machine learning are forced to cobble together homegrown solutions using a patchwork of languages and tools. Otherwise, they must rely on dedicated developers who lack the domain expertise to fluently translate actuarial needs into proper code. This disconnect creates friction and stilts progress.

However, by empowering actuaries to translate their domain expertise into instructions usable by cutting-edge technologies, a dedicated programming language will help align the existing talent in the industry with the untapped potential of data innovation. Modeling insurance is increasingly becoming a multi-disciplinary challenge, and a more precise, specialized programming language will help foster collaboration and jump-start innovation. In other words, our vision is to help big data and life insurance finally speak the same language,

An Interview with Barak Bercovitz: Co-Founder, CTO & Professional Problem-Solver

An Interview with Barak Bercovitz: Co-Founder, CTO & Professional Problem-Solver

by: Dror Katzav, CEO and Founder

January 17th, 2021

Barak Bercovitz, Co-Founder and CTO of Atidot, has applied nearly a decade’s worth of IDF intelligence training to the niche space of long-term insurance and the results have proved fascinating. Meeting his fellow Co-Founder, Dror Katzav, during his army service, Barak explains, “What we learned to do in a very systematic way in our unit is solve ‘seemingly impossible problems’.”
Together, Barak and Dror continued seeking out other unique industries facing “insolvable challenges,” believing that where there is challenge, there is also phenomenal opportunity. Rather than moving into more predictable spaces such as Cyber or Telco, the two became intent on disrupting an industry to create long-lasting change and efficiency.

“We really wanted to make a change. In a way, we wanted to build teams like we used to build in the army to tackle big challenges. Eventually we decided that the insurance industry was one that really needed many changes in how it’s working and operating.”

Detailing a picture of how insurance looked 10 years ago, Barak says “There are all the advances in tech, cloud computing, elastic computing powers and all of that, but insurance professionals are not able enjoy those benefits because they are locked Makes Insurance Smarter
down to legacy systems and older data. The processes are a mess! We realized we wanted to bring our knowledge of how to build very reliable products and solutions that also can be easily operated by insurance people and actuaries.”

Doing so would mean spurring a groundbreaking shift away from traditional insurance practices and moving towards data-driven methods. This would not be an easy task, as insurance companies have become accustomed to tedious manual work as well as spending “hundreds of thousands if not millions of dollars” on consultancy companies to come up with reports.

“Insurance professionals never received a user interface, a dashboard, a tool that is easy enough for them to use—without becoming software developers themselves—to help solve challenges, which include optimizing the book of business, new business, in-force business and basically becoming a data driven business.”

Coming together with their third partner, Assaf Mizan, who at the time was Chief Actuary for Israel’s Ministry of Finance, gave a big push for Atidot to move forward. “Basically, he completed the picture and focused us further on the long-term insurance business, which has many nuances and challenges that are specific to that subfield. Predicting and knowing what’s going to happen in 10 or 15 or 20 years’ time is challenging enough, but the ways it’s been done so far using classical statistics or classical actuarial sciences is really not good enough and can’t be compared to the new solutions of predictive analytics and machine learning that all companies use today.”

Looking with Hindsight

challenges facing the long-term insurance industry. To build their platform, they began researching how insurers used existing technologies and data, as well as the accompanying roadblocks insurers kept meeting along the way.
Barak recalls, “A lot of trial and error from a research perspective but also from an engagement perspective: What are we offering our clients? Are they going to like it or not? Are they willing to pay for it or not? How to work with them? There are big cultural differences with companies from all around the globe and technical issues even with things like privacy regulations, which in a way makes engagement more challenging.”

We realized we wanted to bring our knowledge of how to build very reliable products and solutions that also can be easily operated by insurance people and actuaries.
Barak made sure to add, “But again, when anything is challenging, there is a big opportunity to win by using a combination of an understanding of the insurance business and software development, and by bringing in our machine learning expertise. If we find a way to solve those problems with automation or computer science, then it’s a great win for us.”
Recalling in hindsight some of the Company’s earliest achievements, Barak noted the significance of aligning with some of the biggest insurance companies in the US, which is not trivial for a small Israeli startup. Other important junctures during Atidot’s early stages included the recruitment of a strong development team, marketing and sales personnel, and actuaries who understood the ins and outs of the insurance business. Although today the Insurtech field is exploding, pitching to VC’s in the Company’s earlier stages meant proving the potential of an entirely new category.

“When we began, we just wanted small Israeli companies to talk to us and give us access to their data,” Barak says. Then, “we started developing more of our intellectual property that includes tools that analyze data sources automatically, and solutions that model insurance in better ways than it’s been done before. We started marketing to and approaching American companies, and we managed to get some big lines to talk to us, which was amazing! We really leveraged our connections to do more of that while also developing our understanding of the specific challenges per geography, per company, per scale, for big and small companies alike.”

From here on, the technology itself seemed to take the lead, cutting insurer’s costs and offering deliverables in record times, something that the insurance world had never seen before. The holistic approach of Atidot’s technology helps insurance experts “scope their problems and distill and focus the questions and solutions”. The results are then in the insurer’s hands, tangible and usable in real-time, for actuaries, marketing teams and management alike.

Problem-Solving in the Future

“As a startup we are in a constant street fighting mode to understand what is the best direction and the best way to help as many companies as we can.”

As the world is changing, so are the challenges insurance companies are facing. Currently, long-term contract insurers suffer from high percentages of lapsation and churn, and
The holistic approach of Atidot’s technology helps insurance experts “scope their problems and distill and focus the questions and solutions”.

specifically in the US, there is the ominous question of under-insurance. “Something like 40% of the US is under-insured, meaning their insurance won’t cover their real needs, which is potentially a big problem for a country like the US if something like 2008 were to happens again.” For statistics and information on under-insurance in the US, read Atidot’s most recent Annual Insurance Report.
“We have to adapt ourselves all the time,” Barak explains, “but we’ve built the organization in such a way that we can support those changes and be agile. We try to be agile and answer our clients’ needs as much as we can. From a technological perspective, we developed our solution with an understanding that things are going to change, and if we want to stay competitive and support those changes, we have to model insurance from the ground up.”

As CTO and Chief Visionary Officer, Barak has to stay focused on the company’s long-term vision of becoming the “Bloomberg for insurance policies,” or in other words, becoming the single point of knowledge for universal values of insurance policies. Barak believes there is a growing market for insurance policies, reinsurance and the hedging of insurance data. He explains, “Insurance policies are a financial instrument like a bond or a stock, so our vision is to become a company that has the most powerful and accurate understanding of quality life insurance companies and their strategies.”
“From a tech perspective, I envision regulators and companies using our software libraries and our programming language for insurance because it is such a good language, and lets them express their ideas and scenarios in the insurance domain very easily”. Reaching this goal means identifying which technologies Atidot should be using, learning and developing today to lead the way for success in years to come. To reach these goals, Barak’s top priority is keeping a strong team around him, one that grows better together and continues to find the best insurance solutions out there.
When asked which key skills a company leader needs to succeed, Barak again embraced what he found to be a challenging question. Out of countless qualities he felt helped him along the way, he named patience, ambition and having the right people around as the building blocks of his journey.
“There are so many hurdles when you start a company. You can never win it all. You keep falling and getting up again and again. One important thing is being patient and understanding that no one, really no one, has succeeded without failing. That’s why we chose a tech solution that from the beginning assumes that there will be mistakes and that we can fix them as we go.”
He continues, “What I mean when I say patience and ambition, is that it’s really all about people and their personalities. It’s not about someone’s personality specifically; it is about the collective personality.

When you start a company like ours, you have to believe in co-workers and trust them and give them space to perform. This is something very common in Israeli culture for everyone to come up with ideas, and managers here usually don’t dismiss them, which I’m not sure happens elsewhere in the corporate world.”

Average US Life Insurance Policyholder 74% Under-Insured According to New Study by Atidot

Average US Life Insurance Policyholder 74% Under-Insured According to New Study by Atidot

by: Dror Katzav, CEO and Founder

January 16th, 2021

A report published today by Atidot, an insurance technology company providing AI, big data, and predictive analytics tools to the life insurance industry, exposes the widespread problem of under-insurance in the US life insurance industry. According to the report, only 26% of the total coverage needed for life insurance is currently met, leaving 74% of unmet potential coverage. The report also found that insurance companies are missing out on an average of $785 USD in annual life insurance premium payments per person who requires insurance coverage in the U.S. resulting in a total missed potential of almost $70 billion USD in annual premiums.

“Policyholders are generally unaware that they are underinsured, and the onus must be on the insurance industry to remedy that,” said Dror Katzav, CEO of Atidot. “Life-insurance companies need to be able to utilize the troves of data at their disposal to better engage with their customers. New solutions enable insurers to harness this data efficiently and know when to contact clients to update their coverage and prevent lapsation.”

The report analyzes the levels of insurance on a state-by-state basis, uncovering the rate of under-insurance for individual states and the US as a whole. The State with the greatest percentage of under-insurance is West Virginia with an average of 85%, while Oklahoma, the least under-insured State, still recorded a staggering 51%. The findings clearly show how widespread the problem is, demonstrating an alarming disconnect between providers and policyholders.

The report reveals that companies are forfeiting enormous profit potential and placing their most valuable asset, a loyal customer base, at risk by failing to capitalize on the data they possess. The failure to strategically interact with their clients comes at a substantial cost for insurers and customers alike.

The full report can be found here: https://www.atidot.com/under-insurance-report-2018

Reach An Untapped Market With AI & Predictive Analytics

Reach An Untapped Market With AI & Predictive Analytics

by: Dror Katzav, CEO and Founder

August 28th, 2020

According to the US Census Bureau, women make up 50.8% of the US population. That is more than half of the population, yet women still remain an untapped target market for life insurance companies.


Consider these 5 interesting data points based on LIMRA’s life insurance consumer studies:

  • 47% of women own life insurance.
  • Approximately 14% of women — more than 18 million — lost their life insurance coverage in 2020.
  • While women express more concern about COVID-19 overall, women were less likely than men to say they planned to buy life insurance due to the pandemic (29% versus 33%).
  • Only 22% of women feel very knowledgeable about life insurance. In contrast, 39% of men say they are very knowledgeable about life insurance.
  • Women were more likely than men to say the major reason they have life insurance is to pay for burial expenses (53% versus 44%). Women were much less likely than men to consider it as a way to supplement their retirement income (33% versus 24%).
  • 44% of uninsured and underinsured women say they need (or need more) life insurance


Based on these numbers, you can see that there is still a very large gender gap when it comes to life insurance. With the right data, you can tap into the female market and start closing that gap.


How can you find this data?


Predictive models, enriched by public external data sources, can quickly detect which women have orphaned policies, are on the verge of lapsation, or are in need of a different policy.


AI based models can produce highly accurate results by detecting up to 70% of customers that are about to lapse, saving you time by pinpointing which customers in your existing in-force need to be contacted. These models can tell you which policies are unassigned or potentially underinsured.


Those potential prospects can be ranked by their revenue potential to ensure optimization of resources. Moreover, some platforms can have the inherent capabilities to trigger marketing reach out to those customers, offering an immediate remedy to your customer’s problems.


With AI technology and predictive models, you can generate new revenues from untapped sources while simultaneously providing valuable service to your customers, increasing loyalty and customer satisfaction.


What percent of your in-force is women?


And how many of those women are underinsured or at risk of lapsing?


As International Women’s Day approaches, there is no better time to tap into this untapped market. Take advantage of existing technologies to close the life insurance gender gap and ensure your customers are getting the coverage they need.


About Atidot


Atidot is a nimble growing InsurTech start-up building an innovative AI, Machine Learning platform aiming to change the life insurance industry. We are helping insurers to become data-driven and produce insights to inform decision making and drive new business strategies at the corporate level.


Atidot’s cloud-based, SaaS platform is tailored specifically to the needs of the life insurance industry. We can monetize your data, augment it with external data, and build accurate projections of your in-force book of business. We work with tier one life insurance companies in the US and in the EU and were awarded ‘Cool Vendor’ by Gartner in 2019.